11. Analyzing maps / graphs / charts
The pie chart shows the passing rates of different subjects of a school. Now, write a paragraph analyzing/describing the chart and give a suitable title to it.

Passing rates in different subjects
The given pie chart shows the passing rates of the students of a school in different subjects. The subjects mentioned in the chart are English, Bangla, Science and Mathematics.
As per the version of the chart, of the students have passed in English, of them in Science, of the students have passed in Mathematics and of the students have passed in Bangla. From the chart, it is evident (স্পষ্ট) that the highest number of studerits has passed in Bangla, while the lowest number of students has passed in Science.
The chart gives us a clear picture of the performance of the students of the school. Students' performance in Bangla, Mathematics and English are undoubtedly encouraging, but their performance in Science is not satisfactory. Only students passed in Science. Overall, to sum up the pie chart an arrangement of special coaching classes on Science can be made for the students of this school.
Ai এর মাধ্যমে
১০ লক্ষ+ প্রশ্ন ডাটাবেজ
প্র্যাকটিস এর মাধ্যমে নিজেকে তৈরি করে ফেলো
উত্তর দিবে তোমার বই থেকে ও তোমার মত করে।
সারা দেশের শিক্ষার্থীদের মধ্যে নিজের অবস্থান যাচাই
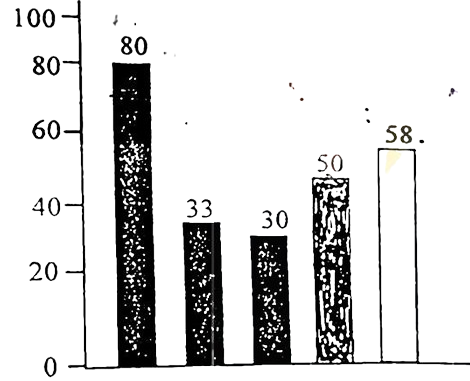
The graph below shows the importance and usage of English. Describe the graph in at least 80 words:
 (By serial)
Usage of English in information technology 80%
Usage of English as the 1st language 33%
Used in various organizations 30%
Used in other purposes 50%
Using English as the 2nd language 58%
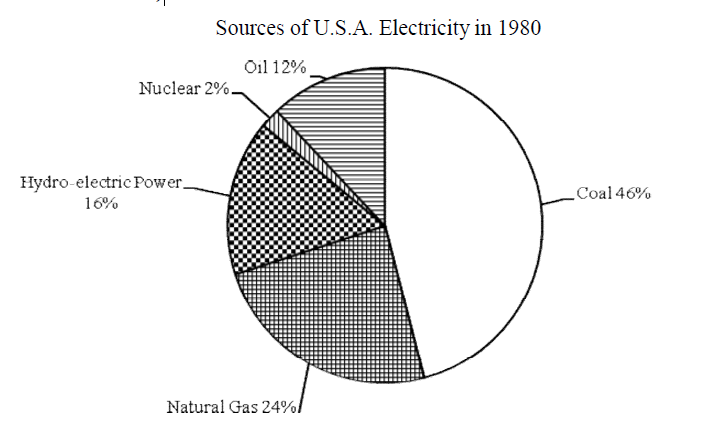
Look at the chart. It shows the sources of U.S.A. electricity in 1980. Now, analyze the chart focusing the main
aspects (At least in 150 words)
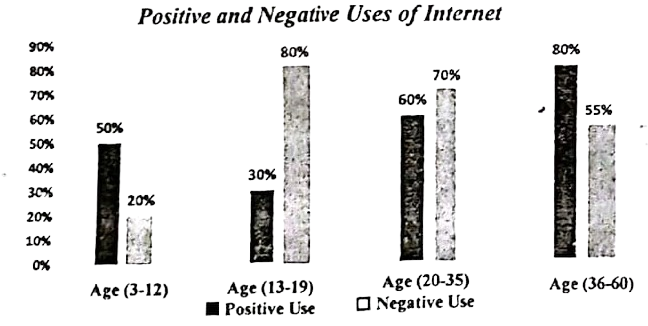
The graph below shows the positive and negative Uses of Internet according to different age groups of the users. Describe the chart at least in 150 words. You should highlight the information and report the main features given in the chart.
Look at the chart. It shows COVID-19 Pandamic cases and deaths by 5 countries on 15 June, 2022. Describe the chart focusing the important aspects and analyse the result in 80 words.
Country | Total Cases | Total Deaths |
|---|---|---|
United States | 857,58,638 | 10,11,925 |
Brazil | 315,41,479 | 6,68,354 |
India | 432,45,517 | 5,24,792 |
United Kingdom | 224,99,617 | 1,79,539 |
Bangladesh | 19,54,405 | 29,131 |