11. Analyzing maps / graphs / charts
Look at the chart. It shows COVID-19 Pandamic cases and deaths by 5 countries on 15 June, 2022. Describe the chart focusing the important aspects and analyse the result in 80 words.
Country | Total Cases | Total Deaths |
|---|---|---|
United States | 857,58,638 | 10,11,925 |
Brazil | 315,41,479 | 6,68,354 |
India | 432,45,517 | 5,24,792 |
United Kingdom | 224,99,617 | 1,79,539 |
Bangladesh | 19,54,405 | 29,131 |
The chart presents COVID-19 data for five countries as of June 15, 2022. The United States has the highest total cases (85.8 million) and deaths (1.01 million). Brazil follows with 31.5 million cases and 668,000 deaths. India reports 43.2 million cases and 524,000 deaths, while the UK has 22.5 million cases and 179,000 deaths. Bangladesh shows significantly lower numbers, with 1.95 million cases and 29,131 deaths. The data highlights the disproportionate impact in the U.S. and Brazil, with higher death rates per case.
Ai এর মাধ্যমে
১০ লক্ষ+ প্রশ্ন ডাটাবেজ
প্র্যাকটিস এর মাধ্যমে নিজেকে তৈরি করে ফেলো
উত্তর দিবে তোমার বই থেকে ও তোমার মত করে।
সারা দেশের শিক্ষার্থীদের মধ্যে নিজের অবস্থান যাচাই
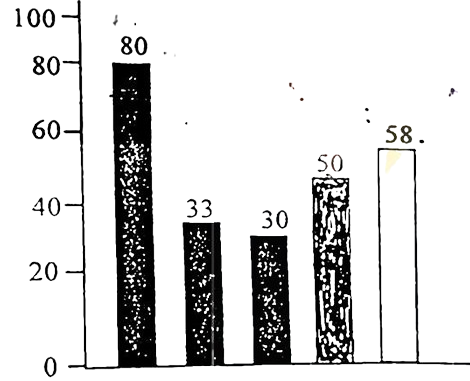
The graph below shows the importance and usage of English. Describe the graph in at least 80 words:
 (By serial)
Usage of English in information technology 80%
Usage of English as the 1st language 33%
Used in various organizations 30%
Used in other purposes 50%
Using English as the 2nd language 58%
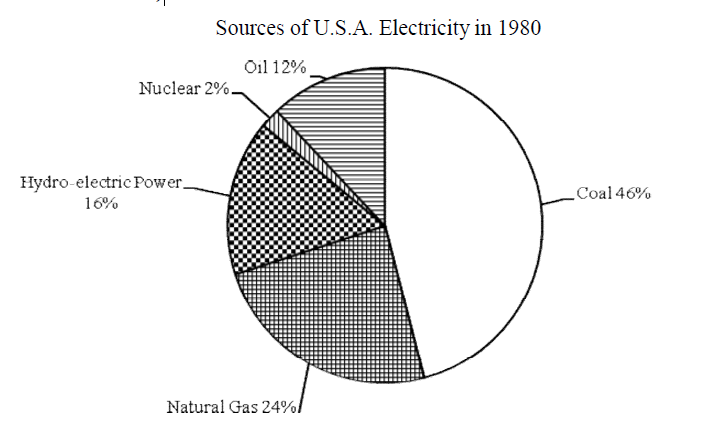
Look at the chart. It shows the sources of U.S.A. electricity in 1980. Now, analyze the chart focusing the main
aspects (At least in 150 words)
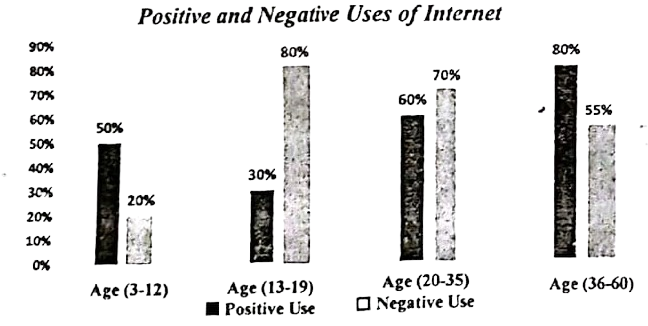
The graph below shows the positive and negative Uses of Internet according to different age groups of the users. Describe the chart at least in 150 words. You should highlight the information and report the main features given in the chart.
fThe graph shows the engagement of child labour in different sectors of 'X' country from 2005 to 2016. Describe the graph in 150 words.
You should highlight the main features and summarize the information given in the graph.
