11. Analyzing maps / graphs / charts
The graph below shows the positive and negative Uses of Internet according to different age groups of the users. Describe the chart at least in 150 words. You should highlight the information and report the main features given in the chart.
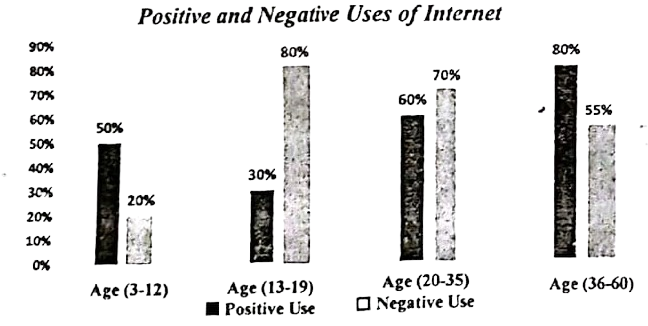
The bar graph illustrates the positive and negative uses of the internet by different age groups. It divides users into four categories: children (3-12 years old), teenagers (13-19 years old), young adults (20-35 years old), and adults (36-60 years old).
Overall, the graph suggests that positive use outweighs negative use for all age groups. However, there is a clear downward trend in positive use as age increases.
Children have the highest percentage of positive internet use, at 80%. The negative use is also the highest for this age group, at 55%.
Teenagers show a similar positive use rate at 80%, with a decrease in negative use to 50%.
Young adults see a slight dip in positive use at 70%, while negative use falls significantly to 20%.
Adults have the lowest positive use at 60%, and the lowest negative use at 30%.
The graph indicates a potential correlation between age and internet safety. While younger age groups engage in more positive online activities, they are also exposed to a higher percentage of negative experiences. As users mature, they tend to gravitate more towards positive online activities.
Ai এর মাধ্যমে
১০ লক্ষ+ প্রশ্ন ডাটাবেজ
প্র্যাকটিস এর মাধ্যমে নিজেকে তৈরি করে ফেলো
উত্তর দিবে তোমার বই থেকে ও তোমার মত করে।
সারা দেশের শিক্ষার্থীদের মধ্যে নিজের অবস্থান যাচাই
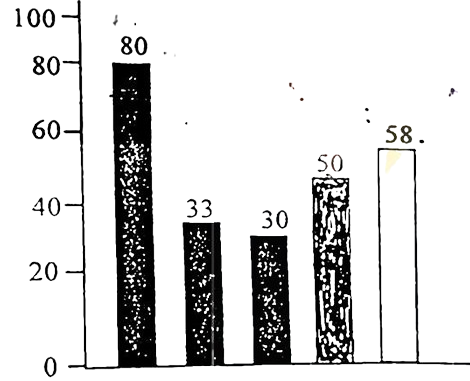
The graph below shows the importance and usage of English. Describe the graph in at least 80 words:
 (By serial)
Usage of English in information technology 80%
Usage of English as the 1st language 33%
Used in various organizations 30%
Used in other purposes 50%
Using English as the 2nd language 58%
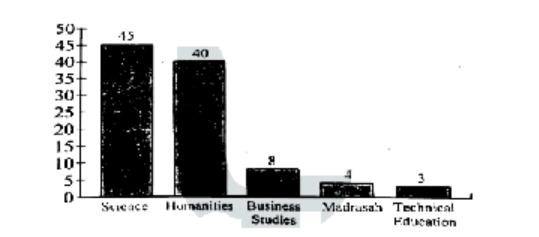
The graph below shows students from different academic areas who got themselves admitted into a public university last year. The left-aligned numbers show the percentages of students. You should analyse the information mentioning, the ratio of their achievements in at least 150 words.